In today’s hyper-competitive market, small businesses face a brutal truth: data is the new gold. But raw data alone won’t save you—transforming it into actionable insights is the key to survival. Enter Microsoft Power BI, a game-changing business intelligence tool that’s democratizing data analytics for businesses of all sizes.
For young professionals in finance, trading, or entrepreneurship, mastering Power BI isn’t just a skill—it’s a profit multiplier. This article breaks down how small businesses are using Power BI to cut costs, optimize pricing, and boost margins, with actionable strategies, real-world examples, and resources to get you started.
Why Power BI? The Data Revolution for Small Businesses
The Profit Margin Crisis
Small businesses lose $100 billion annually due to data inaccuracies 4. Manual processes, siloed data, and guesswork-based decisions are draining profitability. Meanwhile, data-driven companies are 23x more likely to acquire customers and 19x more profitable 2.
Power BI bridges this gap by offering:
- Self-service analytics: No coding skills needed.
- Real-time dashboards: Track KPIs like revenue, expenses, and customer churn.
- AI-powered insights: Predict trends and automate decision-making.
For example, a bakery using Power BI reduced ingredient waste by 20% by analyzing sales patterns, while a retail store boosted margins by 15% through dynamic pricing 8.
Section 1: Understanding Power BI’s Core Features
1.1 Data Integration: Break Down Silos
Power BI connects to 250+ data sources, including Excel, SQL databases, Shopify, and Google Analytics 9. This eliminates manual data entry and ensures all teams work from a single source of truth.
Case Study: A logistics company integrated its ERP system with Power BI, reducing report generation time from 8 hours to 15 minutes 7.
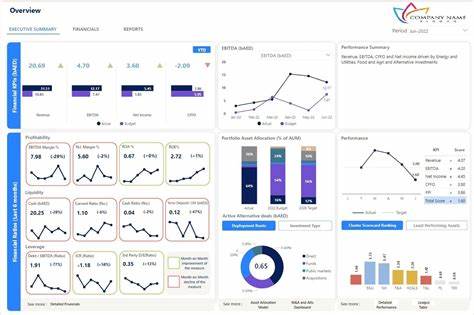
1.2 Interactive Dashboards: See Your Business in Real Time
Power BI’s drag-and-drop interface lets users create custom dashboards tracking:
- Gross profit margins (revenue vs. cost of goods sold).
- Customer lifetime value (CLV) by segment.
- Inventory turnover rates to avoid overstocking 6.
1.3 AI and Predictive Analytics
Power BI’s AI models forecast sales trends, identify at-risk customers, and even suggest optimal pricing. For instance, a SaaS startup used Power BI’s anomaly detection to flag a 30% drop in subscriptions, enabling quick corrective action 9.
Section 2: Slashing Costs with Power BI
2.1 Streamline Operations
- Identify inefficiencies: Audit workflows using Power BI’s process mining. A manufacturing firm saved $50k/year by eliminating redundant steps in production 8.
- Automate repetitive tasks: Use Power Automate to auto-generate invoices or payroll reports, reducing human error 8.
2.2 Optimize Inventory Management
Power BI’s Just-in-Time (JIT) inventory dashboards help businesses:
- Track stock levels in real time.
- Predict demand spikes using historical sales data.
- Reduce holding costs by 25% 8.
Pro Tip: Pair Power BI with Dynamics 365 Supply Chain for end-to-end inventory visibility 8.
2.3 Cut Overhead Costs
- Remote work analytics: Analyze utility costs vs. productivity to optimize office space.
- Supplier negotiation: Use Power BI to compare vendor pricing and negotiate bulk discounts 8.
Section 3: Boosting Profit Margins
3.1 Pricing Strategy Overhaul
- Price elasticity analysis: Test how demand changes with price adjustments. A boutique increased margins by 12% after identifying underperforming products 8.
- Dynamic pricing: Use Power BI to adjust prices based on demand, competition, and seasonality 9.
3.2 Customer Retention Tactics
- Churn prediction: Power BI’s AI flags customers likely to leave, enabling targeted retention campaigns.
- Loyalty program ROI: Track which rewards drive repeat purchases 3.
3.3 Sales Performance Optimization
- Territory analysis: Identify top-performing regions and reallocate resources.
- Upsell opportunities: Analyze cross-selling patterns (e.g., customers who buy Product A often buy Product B) 3.
Section 4: Real-World Success Stories
4.1 Case Study: Local Coffee Chain
A 10-store coffee franchise used Power BI to:
- Reduce food waste by 18% via demand forecasting.
- Increase average order value by 9% through bundled offers.
Result: Profit margins rose from 8% to 14% in 6 months 8.
4.2 Case Study: E-commerce Startup
An online retailer integrated Power BI with Shopify and Facebook Ads to:
- Lower customer acquisition costs by 22%.
- Boost CLV by 35% through personalized email campaigns.
Result: Net profit increased by $120k/year 3.
Section 5: Getting Started with Power BI
5.1 Free Resources
- Power BI Desktop: Free version for small businesses 1.
- Microsoft Learn: Free courses on DAX formulas and dashboard design 2.
5.2 Step-by-Step Guide
- Connect data sources: Import sales, expense, and customer data.
- Build a profit margin dashboard: Track gross, operating, and net margins 6.
- Share insights: Use Power BI Service to collaborate with teams 4.
Recommended Books & Tools
- “Storytelling with Data” by Cole Nussbaumer Knaflic: Master data visualization.
- “The Lean Startup” by Eric Ries: Apply data-driven decision-making.
- Power BI Community Forum: Troubleshoot and share ideas.
References & Citations
- Microsoft Power BI for Small Businesses: Features & Benefits
- The Ultimate Guide to Power BI for Businesses in 2025
- Mastering Power BI: Transforming Data into Strategic Insights
- Power BI Guide for SMBs (2025)
- Calculating Profit Margin for Small Businesses
- ERP and Power BI Integration for Financial Efficiency
- 8 Ways Small Businesses Increase Profits
- 12 Advantages of Power BI
Final Word: Power BI isn’t just a tool—it’s a profitability engine. By turning data into decisions, small businesses can outmaneuver giants. Start small, experiment, and watch your margins soar.